TotaLite Platform Device Management, getting to know your TotaLite Sensors
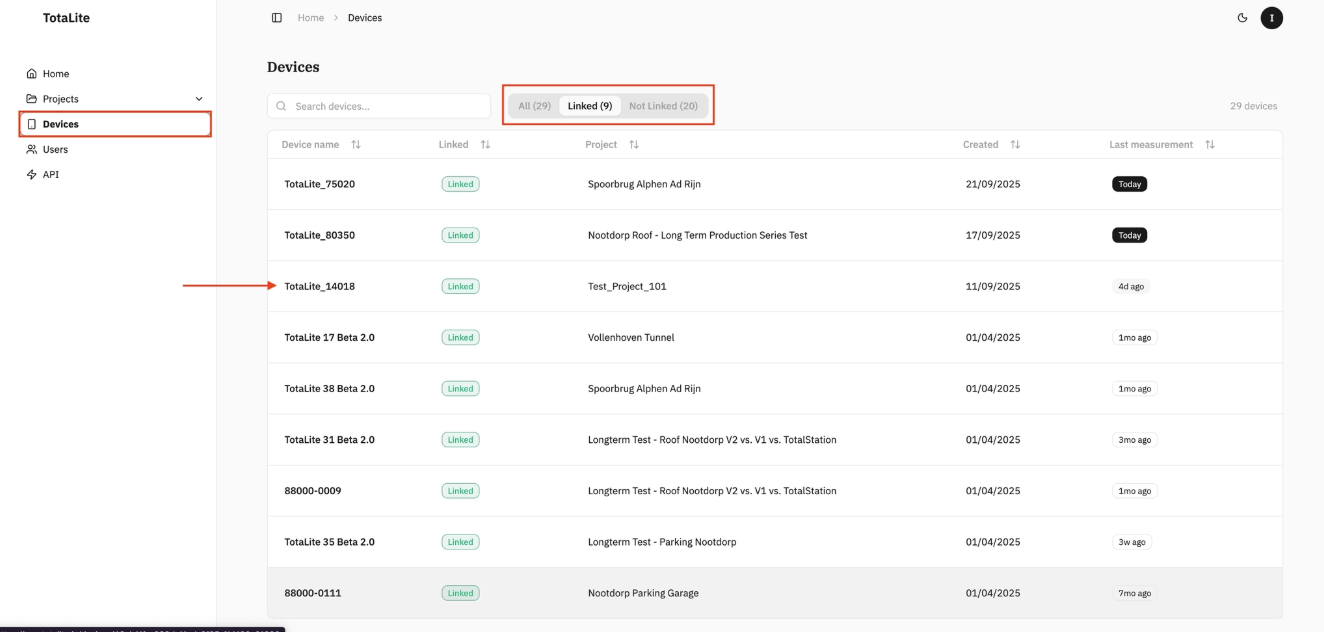
From the Home Page, navigate to the "Devices" page — a full list of devices linked to your organisation. Filter by "All", "Linked" (assigned to a project), or "Not linked" (available to assign). Click any device to open its dedicated page.
Device Page
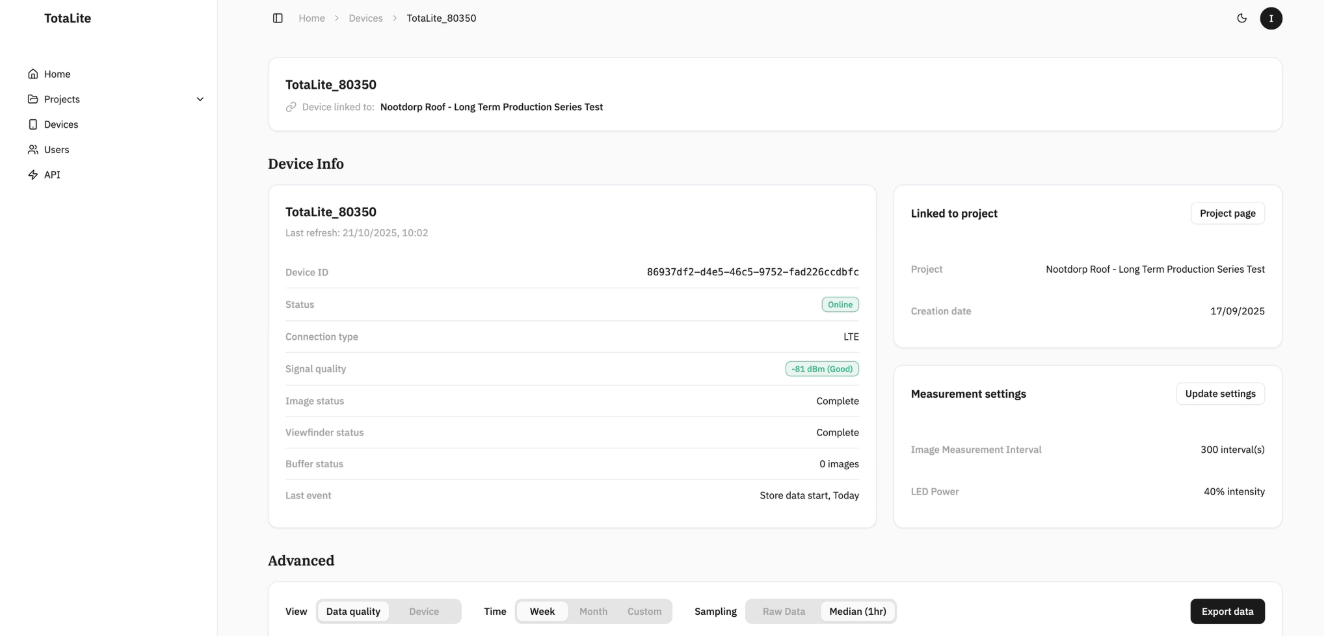
At the top you'll see the device name and its linked project.
"Device Info" gives you a live snapshot of the device:
- "Last refresh" — timestamp of the last heartbeat received
- "Device ID" — unique device identifier
- "Status" — online or offline
- "Connection type" — LTE or Ethernet
- "Signal quality" — LTE-M signal strength in dBm
- "Image status" — idle or measuring
- "Viewfinder status"
- "Buffer status" — indicates whether images are queued in the buffer
- "Last event" — most recent event communicated via telemetry
"Linked to project" shows which project the device is assigned to, its creation date, and a "Project page" button to navigate there directly.
"Measurement settings" shows the current "Image Measurement Interval" (in seconds) and "LED Power" (as a percentage). Click "Update settings" to make changes.
Advanced
Scroll down for advanced diagnostics, split into Data Quality and Device sections. All metrics can be viewed weekly, monthly, or over a custom period, with sampling options for Raw Data or Median.
Data Quality
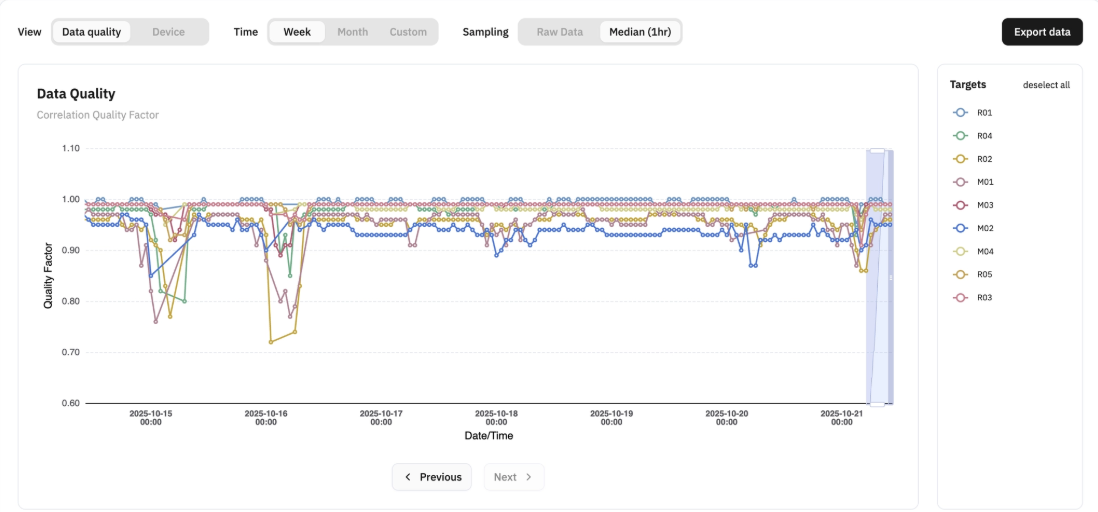
Correlation Quality Factor (CQF)
Measures how closely the target image matches an ideal response — in other words, image quality. Closer to 1 is better.
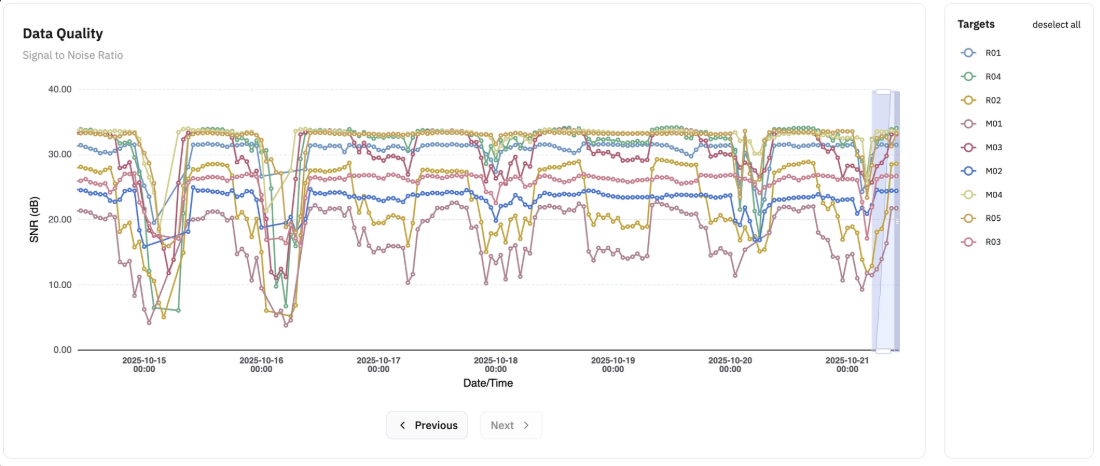
Signal to Noise Ratio (SNR)
Measures the brightness of the target image relative to noise.
- Above 21 dB — good
- 18–21 dB — acceptable, not optimal
- Below 18 dB — needs improvement
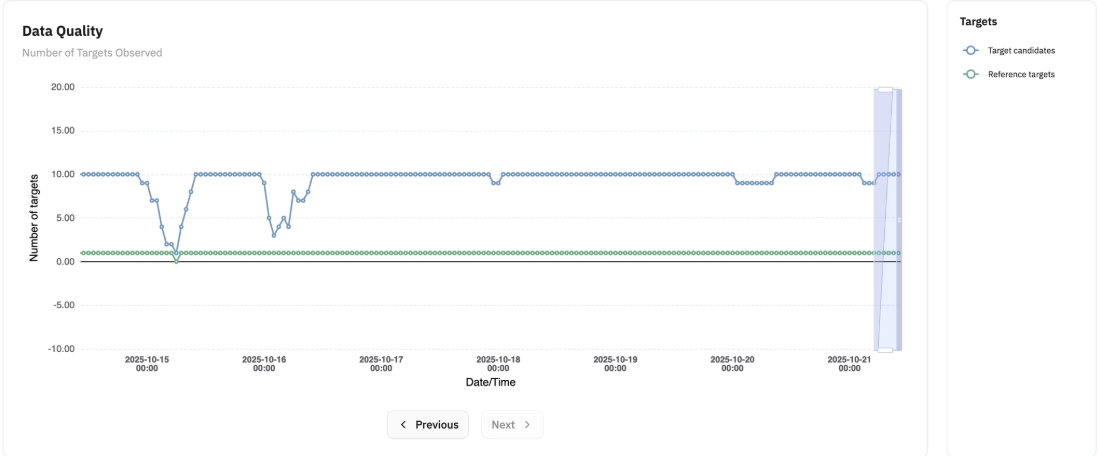
Number of Targets Observed
Tracks how many targets were successfully detected in each measurement cycle. Use this to spot missed detections caused by obstructions, lighting conditions, or system issues — and to verify consistent data completeness across your monitoring network.
Device
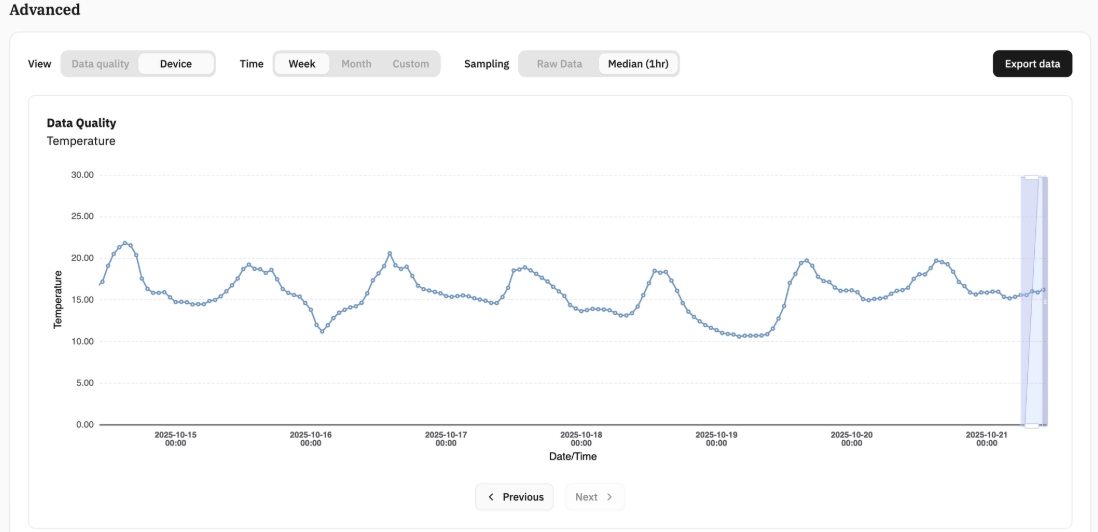
Temperature
Monitors the sensor's internal optical system temperature. Temperature fluctuations affect focal distance, which can introduce systematic errors in displacement readings. Compare temperature data against displacement measurements to separate real structural movement from thermally-induced artifacts.
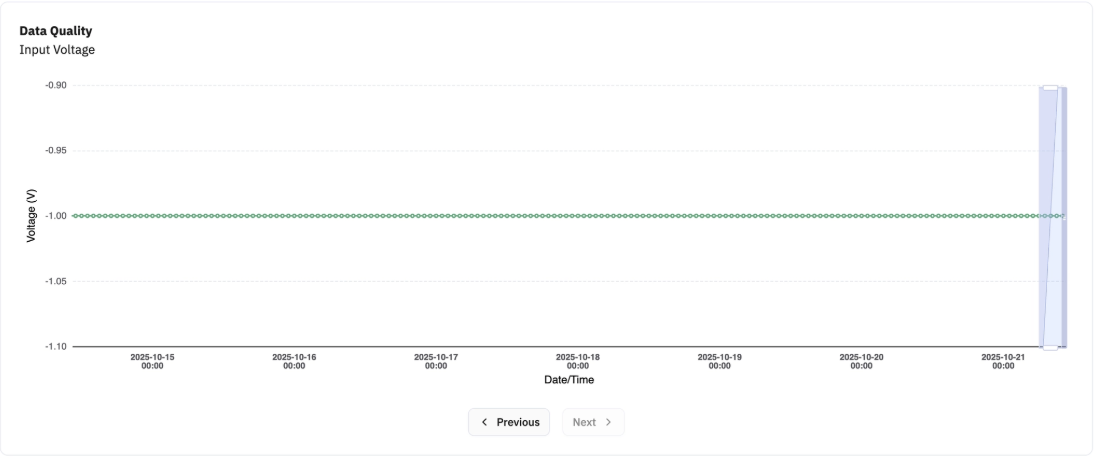
Sensor Input Voltage
Monitors power supply voltage to ensure stable operation within the required 9.5–24V range. Use voltage data to identify drops or fluctuations and diagnose measurement anomalies that correlate with power supply variations.
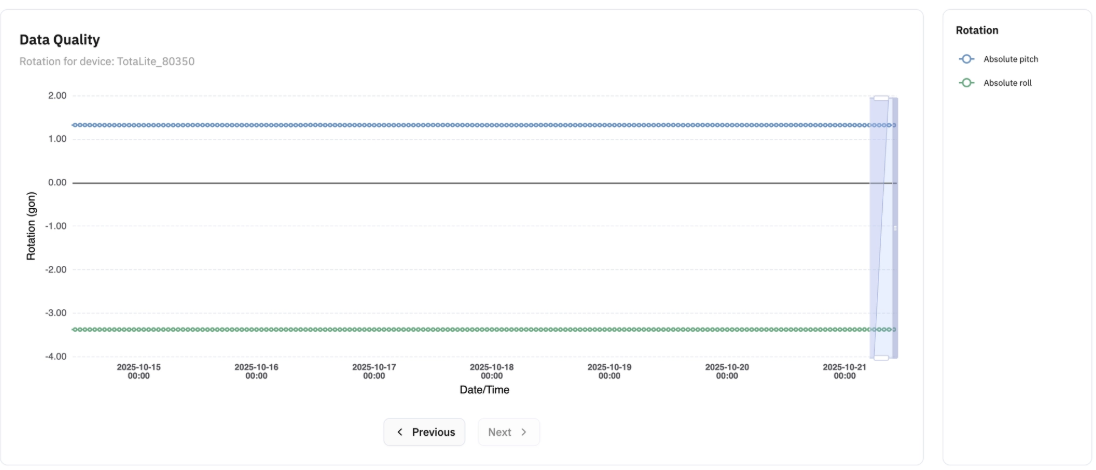
Sensor Rotation
Tracks rotational movement of the sensor itself to verify mounting stability and confirm the built-in motion compensation algorithm is functioning correctly. Excessive rotation may indicate a mounting issue requiring attention. Use this data to distinguish between actual target movement and sensor-induced measurement variations.